Where Caring & Science Create Solutions


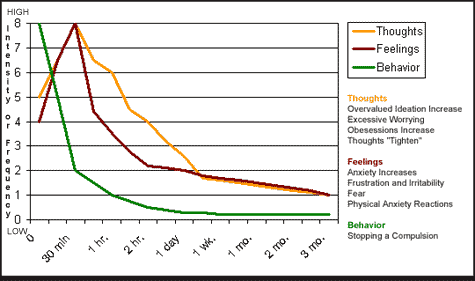
This chart shows the pattern of Thoughts, Feelings and Behaviors on a line graph of intensity of frequency over time. The intensity of frequency ranges from zero (low) to 8 (high) while the time ranges from zero minutes to 3 months.
Thoughts are described with the following:
Feelings are described with the following:
Behaviors are described with the following:
Thoughts start out at zero minutes with an intensity of 5. They peak at about 45 minutes at an intensity of 8 and go down gradually to about 1 at 3 months.
Feelings start out at zero minutes with an intensity of 4. They peak at about 45 minutes at an intensity of 8 and go down gradually a bit quicker than thoughts to about 1 at 3 months.
Behaviors start out at zero minutes with an intensity of 8. In about 45 minutes they drop down to an intensity of 2 and curve gently down to almost zero at 3 months.